


Estuary Health and Swimming Conditions
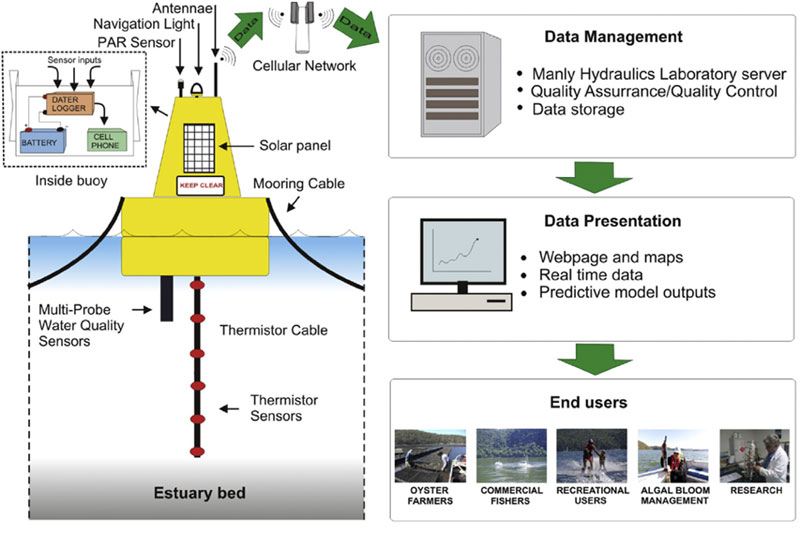
Hornsby Shire Council has been monitoring the Lower Hawkesbury estuary since the 1990s. Monitoring has been undertaken through both routine field sampling and by remotely deployed monitoring stations (i.e. permanently moored buoys). These remote floating stations have been used to monitor the estuary since 2004 and the program have received a number of awards including the 2018 Green Glove Awards for the Public Sector Leadership.
Currently, seven telemetered water quality monitoring stations are located along the salinity gradient, from Laughtondale (near Wisemans Ferry) down to the mouth of the Hawkesbury at Broken Bay. The stations monitor a range of parameters like temperature, turbidity, salinity and chlorophyll-a at (a minimum of) half hour intervals, then transmit the data to an online web portal – Hawkesbury Watch.
In addition to the seven water quality stations, another nine estuarine sites are field sampled quarterly. Water quality in the estuary varies spatially, with relatively good water quality towards the mouth of the estuary to more impacted sites in the upstream reaches. Sites that are closer to the freshwater tidal limits are more susceptible to problematic catchment inputs, such as pulses of bacteria during wet weather. Estuarine sites are also exhibiting impacts from pressures that extend well beyond the Hornsby LGA, particularly with regards to increasing nutrient concentrations.
Sampling parameters
| Parameter | Measure | What does it tell us? |
|---|---|---|
| Temperature | oC | Water temperature influences the rates of chemical and biological processes and affects other measured parameters (e.g. as temperature increases, the maximum amount of dissolved oxygen decreases). |
| Electrical conductivity | µS/cm or mS/cm | Used in freshwater as a measure of the saltiness of the water and is measured on a scale from 0 to 50,000 uS/cm. Electrical conductivity is measured in microsiemens per centimeter (uS/cm). Freshwater is usually between 0 and 1,500 uS/cm. |
| Turbidity | NTU | Indicates how much particulate matter is in a water sample. If turbidity appears in the water, it may indicate water pollution. |
| Dissolved oxygen | %sat, mg/l | As a measure of oxygen available in water. It is an essential parameter in assessing water quality because of its influence on the organisms living within a body of water. Oxygen is used during the decomposition of organic matter and low levels of oxygen can indicate a waterway is out of balance, e.g. the production of too much algae that then breaks down and removes oxygen from the water. |
| pH | Units | Measured between 0 and 14 to determine how acidic or alkaline, with 7 being neutral. |
| Salinity | PPT | Used in estuartine and marine water as a measure of the dissolved salt content. |
| Parameter | Measure | What does it tell us? |
|---|---|---|
| Total suspended solids | TSS | TSS are a measure the amount of particulate matter (tiny pieces of things) floating in water. TSS can be useful as an indicator of the effects of runoff from construction, agricultural practices, sewage treatment plant discharges, and other sources. As with turbidity, concentrations often increase sharply during rainfall |
| Chlorophyll-a | µg/L | Chlorophyll-a provides a good assessment of the primary production or algal activities in a waterbody. The direct causes of algal blooms are often associated with increased total phosphorous (TP) and/or total nitrogen (TN) levels in a waterbody |
| Bacteria | Faecal coliforms, E.coli, enterococci | Bacteria measures a water source's safety by estimating the number of bacteria in a sample and determining which species are present. The initial process doesn't detect dangerous organisms. Rather, it detects “indicator organisms” that are more common in places with higher amounts of pathogens |
| Nutrients | TN, TP, NH3-N, NOx-N, SRP |
Nutrients are essential for the survival of aquatic organisms and nutrients are tested to ensure levels remain safe. The overuse of fertilisers, which contain nitrogen, phosphorus, and potassium, have the potential to be harmful if ingested by humans and animals.
Nitrogen in water can come from both organic and inorganic sources. Nitrogen from organic sources includes animal wastes and living things, whereas nitrates are the most common form of inorganic nitrogen. Nitrates are odourless and colourless, so it is crucial to test drinking water to determine levels of nitrates. High concentrations can cause congenital disabilities and become toxic to livestock. Phosphorus limits plant growth in a waterbody, so only adding a small amount of this can cause excessive plant growth, which can use up oxygen, affecting fish and macroinvertebrates. Runoff, building activities, damage to vegetation, fertilisers, and poorly functioning septic tanks can all affect phosphorus levels. |
- Temperature
- Turbidity
- Salinity
- Chlorophyll-a
- PAR (photosynthetically active radiation – the spectrum of solar radiation used DURING photosynthesis) at Calabash Bay monitoring station only.
Information from estuarine monitoring informs land use planning decisions, catchment and estuary health condition, and matters of public safety (such as swimming, the presence of toxic algae and safe consumption of seafood). The web portal also incorporates water levels and rainfall data. The availability of a long term, quality controlled continuous dataset has benefited the operations and strategic decision making of many government agencies, including Sydney Water and the NSW Department of Planning & Environment (DPE).
Unique to Hornsby Shire Council's monitoring program is the ability to provide near real time data to inform the community on daily swimming conditions which can in turn improve public health at popular recreational sites. Given popular swimming sites are significantly impacted by wet weather urban run-off, wastewater overflows and discharges from treatment plants it is crucial to ensure the continuity of monitoring and daily advice to inform the public on current swimming conditions. Linking the real-time information with the results from our monitoring program is unique in NSW.
The information collected by the monitoring stations also provides a comprehensive understanding of the hydrodynamics of the system which is key to improving the management of the estuary. This has been recognised by Sydney Water and NSW Department of Planning and Environment who have utilised the high quality spatial and temporal resolution of the dataset to validate modelling work being undertaken for the wider Hawkesbury-Nepean system.
Currently information from these probes is also assisting the oyster industry and the NSW Food Authority to better manage the oyster harvest areas in the Lower Hawkesbury.